Executive Summary
Problem
The client was a large multi-national SaaS company that runs sales across thousands of accounts and dozens of product lines. Sales reps have the daunting task of deciding which accounts to pursue (both for upsell and new logo). Traditionally they spent hours per account on manual research: recent company news, hiring trends, prior purchases, product fit. That does not scale across the many territories they cover, produces inconsistent account prep between reps, and lets high-value opportunities slip through. Off-the-shelf CRM and analytics tooling could not combine historical transaction data with live, account-specific research and turn it into a sales-ready recommendation.
Solution
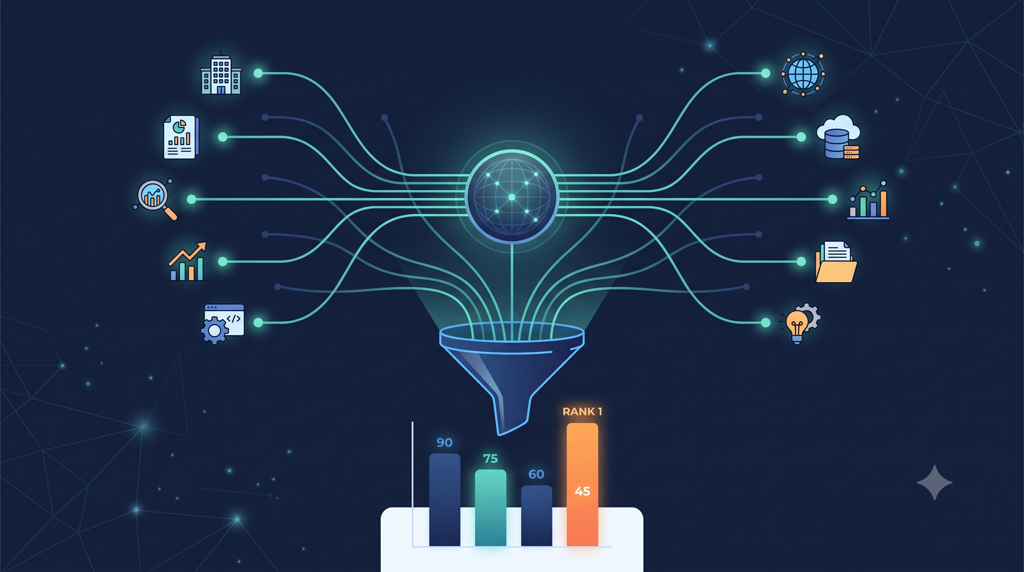
We built a custom, GCP based sales intelligence platform that automates prioritization and research end to end. A SQL transformation pipeline standardizes raw CRM, revenue, and engagement data into ML-ready features. Gradient-boosted models predict purchase likelihood and expected deal value per product line (one per upsell and new-logo). In parallel, a generative-AI research layer fans out across dozens of parallel workers, combining account context with live web research to produce a structured recommendation per account: qualitative findings, a suggested sales play, talk track, and discovery questions. A managed ML pipeline orchestrator coordinates every stage, deployed through CI/CD across isolated development, test, and production environments.
Outcome
The platform launched broadly at the company’s annual sales kickoff. Feedback was strongly positive across front-line reps, sales leadership, and executives Predictions and research converge into a single reporting table that downstream sales tooling consumes directly, replacing ad hoc manual research with a repeatable, auditable pipeline. At representative volumes — on the order of low thousands of accounts per run — a full pipeline completes in a few hours end to end, with the research stage accounting for most of that time.
The challenge
1. From messy operational data to ML-ready features
The client wanted a solution that could score an entire territory consistently, not just the accounts a rep happened to have time to research. The raw inputs were familiar enterprise shapes: CRM accounts, opportunities, and contracts; revenue and order history; usage and engagement signals. None of it arrived in a form models could consume directly.
The first big challenge was not training a model, but building a trustworthy feature layer on top of data that had never been designed for machine learning.
We implemented a SQL-based transformation framework using dbt. It progressively refines the data through layers: light standardization, core dimension and fact tables, then feature engineering rollups, pivots, sales-play assignment logic, and usage-trend features. Each layer is declaratively defined, dependency-tracked, and covered by automated data-quality tests: uniqueness, not-null, referential integrity, accepted-value checks. The output is a set of ML-ready master tables, one per model consumer (upsell or new-logo).
Ingestion from upstream source systems is treated as external to the platform. Since the planned re-run was on the scale of weeks, we opted for a simpler solution — a scheduled pull from the warehouse’s raw tables. That boundary kept the project focused on what we could own and test.
2. Hurdle models across product lines and motions
Upsell and new-logo are different problems. So are the company’s individual product lines. A single conversion score would have hidden the structure reps actually work with.
We applied a hurdle model design using XGBoost: a classification model estimates the probability that a purchase event occurs, and a regression model estimates expected deal size conditional on a purchase. Multiplying the two yields an expected-value prediction per account per product line. This pattern runs independently for expansion and new-business motions, and independently per product line plus an aggregate total model — eight models per motion.
Models are versioned, trained offline with cross-validated evaluation (AUC-ROC, precision/recall, Brier score for classifiers; MSE/MAE for regressors), and calibrated before deployment. We separated model logic from cloud storage with a local-first artifact pattern: training and inference always read and write local artifacts first, with cloud upload as an explicit opt-in step. That kept the modeling code testable without standing up cloud resources for every unit test.
Hyperparameters are loaded via YAML and can be overridden by groupings and variants — tuned parameters proved more suitable than defaults for most production runs, especially when experimenting with small feature changes.
3. GenAI research at scale
Quantitative scores (propensity to upsell or buy) answer “who to call.” Reps still need to know “what to say.” That second half is where manual research used to eat hours per account.
For each account, a GenAI research component builds a structured opportunity card: firmographic and CRM context; qualitative findings gathered via an LLM with live web searches (business context, hiring signals, M&A activity, notable incidents); recommended sales plays; and enablement content — a talk track, discovery questions, and cited sources. Multiple searches are performed in parallel for each account and the outputs are validated via JSON schemas (Pydantic models).
Parallelism and robustness
We initially thought API rate limits would be the bottleneck, but it turned out to be response latency. LLM calls with web search enabled typically took 30–180 seconds each. We observed that latency increased with the number of concurrent calls. Unfortunately, at the time OpenAI did not support web search in batch mode. So we had to come up with a robust solution that could handle thousands of requests in parallel.
To keep that parallelism reliable we built in several mechanisms:
- A worker-pool execution model — bounded concurrent workers pulling from a queue, rather than one task per record — so very large batches do not exhaust memory or hit orchestrator timeouts.
- Per-request HTTP timeouts layered under application-level retries.
- An optional circuit breaker that stops issuing requests during a sustained provider outage and probes for recovery.
- An optional adaptive-concurrency controller that watches p95 latency and dynamically grows or shrinks the worker pool — an AIMD-style pattern borrowed from networking.
- State management to avoid duplicate requests and automatically retry failed requests.
Individual record failures are isolated; one account’s LLM call failing does not halt the batch. A graceful-shutdown path drains in-flight work before a run is interrupted.
Two implementation paths exist: a single-prompt path against a general-purpose LLM API (the primary production path) and an alternative multi-agent path built on a separate agent framework, used as a secondary experimental option. A LangGraph-orchestrated research pipeline generalizes the pattern into a YAML-configured DAG of research and aggregation nodes, so new research dimensions can be added without touching pipeline code.
Monitoring and validation
We originally wired Langfuse in for centralized golden-dataset comparisons and monitoring, but discontinued it.
The cost of the cloud offering quickly ballooned with the volume of data and calls we were running, and stopped justifying the benefit.
Instead we implemented a local solution that was more robust and easier to maintain.
A local workflow replaced it for consistency testing. It used local data storage and processing. Since the output of the LLM was mostly categorical and ordinal data, it lent itself to statistical analysis and validation.
We not only compared the outputs against a golden dataset, but also performed a statistical analysis to ensure that the outputs were consistent between multiple runs. The challenge was condensing the dozens of fields into a few key metrics that could be used for regression testing.
4. Orchestrating the full run on Vertex AI
End to end, a typical run is: transformation builds ML-ready inputs → propensity models run inference and write predictions back to the warehouse → a second transformation pass refreshes the research-layer input table with fresh predictions → the account population splits into batches distributed across parallel workers → each worker calls the LLM per account and writes results back (via direct BigQuery write or a pub/sub-style queue, depending on credential mode) → a final transformation pass produces reporting tables.
All ML and research workloads are coordinated by a Kubeflow-based pipeline orchestrator on Vertex AI. We split Vertex pipelines into their own sub-modules so the runner can execute arbitrary pipelines and the DAG logic lives in code — easier to port if the orchestrator changes later. One optimization I am particularly happy with: users can skip multiple DAG steps entirely without waiting for unnecessary container runs.
For experimentation on feature branches, we can replace the container tag with a PR number and override the default dbt user to test against a custom namespace of tables. That made iteration on pipeline changes much less painful than redeploying everything to production.
5. Making the system operable after handover
The hardest part of a platform like this is not the first successful run — it is the n-th run, by someone who did not write the original code.
By handover, the systems were in good shape, but configuration ergonomics needed work. Complex BigQuery input queries passed as CLI parameters were painful to escape correctly; we aligned on YAML as the standard for persistent configuration and query logic, reserving CLI overrides for experimentation. Hydra manages cascading config with a master YAML governing all agents and modes; DAG YAML files specify agents and inputs for faster iteration on the research layer. System and user prompt templates can be overridden in the DAG config for minor changes without spinning up a new agent sub-module.
At current scale the architecture has comfortable headroom. Beyond a few thousand accounts per run, full reprocessing every time would need to move toward incremental processing (only re-researching changed accounts) or a cached-research layer, since cost and runtime scale roughly linearly with account count and LLM cost per account. We documented that ceiling explicitly rather than pretending the first design would last forever.
The solution
The platform follows five layers with narrow responsibilities:
- Ingestion — Raw operational data lands in BigQuery from upstream systems on a schedule.
- Transformation — dbt for warehouse layers with automated data-quality tests produce ML-ready master tables.
- Prediction — XGBoost hurdle models for upsell and new-logo, per product line, writing predictions back to the warehouse.
- Research and synthesis — Parallel GenAI workers produce schema-validated opportunity cards per account.
- Reporting — A final join of latest ML predictions and latest research outputs per account into a single hand-off table for dashboards, exports, and downstream tooling.
Infrastructure is defined as code across three isolated environments (development, test, production), promoted through CI/CD that lints, tests, builds container images, and applies infrastructure changes on merge. API credentials live in a secrets manager, never in code. IAM is scoped to dedicated service accounts per pipeline stage.
graph TB
    subgraph SRC["Source Systems"]
        CRM["CRM Data<br/>(accounts, opportunities, contracts)"]
        REV["Revenue & Order Data"]
        ENG["Engagement / Usage Data"]
    end

    subgraph DW["Cloud Data Warehouse — Transformation Pipeline"]
        RAW[("Raw Source Tables")]
        STD["Standardization Layer"]
        CORE["Core Dimensions & Facts"]
        FEAT["Feature Engineering Layer"]
        MASTER[("ML-Ready Master Tables")]
    end

    subgraph ML["Prediction Layer — ML"]
        UPSELL["Upsell Propensity Models<br/>(conversion + value, per product line)"]
        NEWLOGO["New-Logo Propensity Models<br/>(conversion + value, per product line)"]
    end

    subgraph GENAI["Research & Synthesis Layer — GenAI"]
        SPLIT["Batch Splitter"]
        WORKERS["Parallel Research Workers"]
        LLM(["LLM Provider<br/>+ Web Search"])
    end

    subgraph RPT["Reporting Layer"]
        LATEST["Latest-Snapshot Tables"]
        FINAL[("Final Reporting Table")]
    end

    subgraph OUT["Output Consumers"]
        EXPORT["Scheduled Export"]
        DASH["Downstream Dashboards / Tools"]
    end

    ORCH{{"Managed ML Pipeline Orchestrator"}}

    CRM --> RAW
    REV --> RAW
    ENG --> RAW

    RAW --> STD --> CORE --> FEAT --> MASTER

    MASTER --> UPSELL --> LATEST
    MASTER --> NEWLOGO --> LATEST

    MASTER --> SPLIT --> WORKERS
    WORKERS <--> LLM
    WORKERS --> LATEST

    LATEST --> FINAL --> EXPORT
    FINAL --> DASH

    ORCH -. orchestrates .-> STD
    ORCH -. orchestrates .-> UPSELL
    ORCH -. orchestrates .-> NEWLOGO
    ORCH -. orchestrates .-> SPLIT
    ORCH -. orchestrates .-> FINAL
The transformation pipeline standardizes raw source data into ML-ready feature tables. Two independent model families produce quantitative predictions while a parallelized GenAI research layer produces qualitative account narratives. Both streams converge in a reporting layer that feeds downstream consumers. A managed orchestrator coordinates every stage end to end.